| Meeting Brochure and registration form SMDM Homepage | |

|

|
|
||||
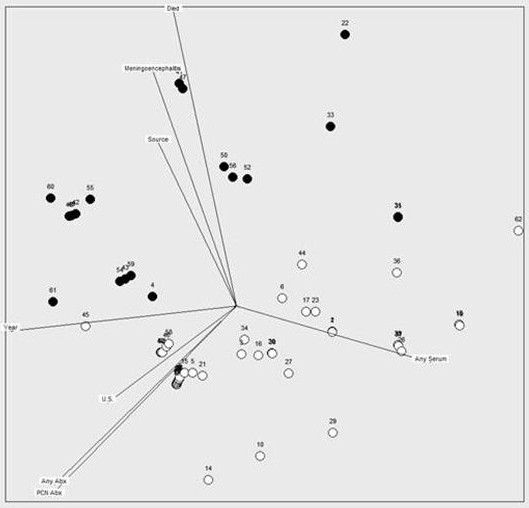
Methods: CoPlot simultaneously evaluates associations between variables and between observations by superimposing two maps in sequence. The 1st map uses multidimensional scaling to spatially represent the distances between observations (represented as circles). The 2nd map generates vectors that display the relationships among the variables. In the CoPlot map, similar observations are located close to one another, and clusters of observations are described by the variable vectors. We present an example using CoPlot on data from a recently published systematic review of clinical features and disease progression of 62 children with anthrax.
Results: Although this review is the largest published case series, it was limited by the small number cases for key subgroups (e.g., by source of infection). We used CoPlot to further explore the association between the demographic and treatment variables, labeling cases according to whether the patient lived (white) or died (black). From this map, we readily identified several relationships in the data—some of which were not detected from univariate or regression analyses. The use of serum was associated with survival (82% vs 71% of children who received antibiotics). Several variables, such as the source of anthrax being inhalational or gastrointestinal rather than cutaneous, the development of meningoencephalitis, and death were highly correlated (their vectors point in the same direction). Other variables, such as the year of the publication of the case report and the use of antiserum were highly negatively correlated (their vectors fall along the same axis but in opposing directions). CoPlot readily identified outliers (e.g., case 62 located at the right of the map was a 2˝ year old girl with inhalational anthrax who survived. She is unusual because only 8 cases were <3yrs, 2 cases had inhalational anthrax (the other child died), and 24% of the cases were girls).
Conclusions: CoPlot is a promising method for exploring the association between observations and variables in multivariate data. CoPlot rapidly produced maps for hypothesis testing, for the identification of outliers and errors in the data, for visual assessment of the relationships within the data, and for the selection of key variables for subsequent regression analysis.
See more of Poster Session IV
See more of The 28th Annual Meeting of the Society for Medical Decision Making (October 15-18, 2006)